
NASA’s Solar Eclipse Map offers an opportunity to plan where you will be for the upcoming annular solar eclipse on October 14, 2023, and total solar eclipse on April 8, 2024.
These two solar eclipses are unique in that they will cross the United States in two consecutive years. On October 14, 2023, an annular solar eclipse will create a “ring of fire” in the sky from Oregon to Texas. On April 8, 2024, a total solar eclipse will darken the skies from Texas to Maine. On both dates, all 48 contiguous states in the U.S. will experience a minimum of a partial solar eclipse meaning the entire nation can join together to experience these unique celestial events.
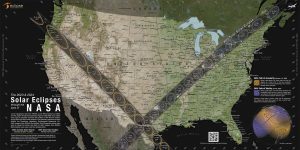 NASA’s Solar Eclipse Map was developed using data from a variety of NASA sources and shows both eclipse paths as dark bands as can be seen from the image included here of the map. Outside those paths, yellow and purple lines show how much of the Sun will become blocked by the Moon during the partial eclipses.
This unique view into the upcoming eclipses is based on observations from several NASA missions. Unlike any other eclipse maps, using NASA’s data from the missions provides the ability for the map to detail the path of the Moon’s shadow as it crosses the contiguous U.S. during the upcoming solar eclipses. These dark paths across the continent show where you will need to be to see the “ring of fire” when the Moon blocks all but the outer edge of the Sun during the annular eclipse, and the ghostly-white outer atmosphere of the Sun (the corona) when the Moon completely blocks the Sun’s disk during the total eclipse.
Outside those paths, the NASA’s map also shows where and how much the Sun will be partially eclipsed by the Moon. On both dates, all 48 contiguous states in the U.S. will experience at least a partial solar eclipse as will Mexico and most of Canada. It will truly be a North American spectacle for hundreds of millions of people to experience.
On NASA’s Solar Eclipse Map, as mentioned earlier, the paths for the annular eclipse and total eclipse appear as dark bands across the United Stages. If you are located in the annular eclipse path this October, from Oregon to Texas, you will have a chance to see the full annular eclipse if the skies are clear. Anyone located in the total eclipse path, from Texas to Maine, will have a chance to see the April 2024 total eclipse.
Inside the map’s dark paths are oval shapes with times inside them (yellow ovals for the annular eclipse, purple ovals for the total eclipse). Those ovals show the shape of the Moon’s shadow cast on Earth’s surface at the times shown. If you are in the areas inside the ovals, you will see the annular eclipse or total eclipse at that time.
The Moon’s shadow will move quickly during both eclipses. On NASA’s Solar Eclipse Map, ovals within the eclipse paths show the location and shape of the shadow at different times. For example, during the total eclipse on April 8, 2024, the Moon’s shadow will be over Dayton, Ohio, at 3:10 p.m. EDT, but by 3:20 p.m. EDT it will quickly have moved to Buffalo, New York.
For locations close to the center of the paths, the annular eclipse or total eclipse will last longer than those near the outer edges of the path. Inside each path on the map are white lines that indicate how long annularity or totality will last. For the annular eclipse path, you can find labels (ranging from 3 to 4.5 minutes) near the Nevada-Utah border in the north and between San Antonio and Corpus Christi, Texas, in the south. For the total eclipse path, you can find labels near Presque Isle, Maine, in the north, and between the 2:20 and 2:25 p.m. CST ovals in Mexico in the south.
The closer to the center of the eclipse path, the longer each eclipse will last. On the NASA’s Solar Eclipse Map, each eclipse path includes white lines that indicate how long that eclipse will last at different locations. For example, the annular phase of the eclipse will last about four minutes near Elko, Nevada, and about four and a half minutes near Richfield, Utah.
If you live in a location outside these eclipse paths, you will not experience a total solar eclipse or annular eclipse, but you still may still see a partial eclipse. Lines running parallel to each path indicate how much of the Sun will become covered by the Moon during the partial eclipse. For the annular eclipse, these lines appear faint yellow. For the total eclipse, they’re faint purple. Percentage labels for the annular eclipse lines appear along the left and top edges of the map. The percentage labels for the total eclipse appear along the bottom and right edges of the map and the percentages appear at the same angles as the lines.)
Outside of the eclipse paths, purple and yellow lines on the map show the percentage of the Sun that will become covered by the Moon at different locations for the total and annular eclipses, respectively. For example, the purple line that passes near New York City and Providence, Rhode Island, indicates that the Sun will become about 90 percent obscured in those cities during the peak of the eclipse on April 8, 2024.
Neither eclipse will be limited to the contiguous United States. In the lower right corner of NASA’s Solar Eclipse Map, a globe shows the full paths for both eclipses. The annular eclipse (in yellow and black) extends into Mexico, Central America, and South America. The total eclipse (in purple and black) also crosses Mexico and northeastern Canada. Shaded bands (yellow for the annular eclipse and purple for the total eclipse) also show where a partial eclipse can be seen. For example, in October 2023, southeastern Alaska will experience a partial eclipse, while Hawaii will have a chance to see a partial eclipse in April 2024.
In its release of the eclipse map, NASA noted that Michala Garrison, a member of the Scientific Visualization Studio (SVS) at NASA’s Goddard Space Flight Center, applied her background in geography and cartography to design the map, incorporating information from a variety of NASA sources.
Earth elevation information came from the Shuttle Radar Topography Mission, while maps of the Moon’s shape were supplied by Lunar Reconnaissance Orbiter. The positions of the Sun, Moon, and Earth were found using software and data from NASA’s Navigation and Ancillary Information Facility. Garrison’s SVS colleague, Ernie Wright, used all of this information to calculate the location and shape of the Moon’s shadow.
NASA’s Blue Marble – a global mosaic of satellite images assembled by the NASA Earth Observatory team – provided color for the land. And one particularly unique feature Garrison thought to add along the path of the 2024 total eclipse was nighttime imagery of Earth from NASA’s Black Marble – which shows city lights on the night side of the planet as imaged by the Suomi NPP spacecraft.
As noted by the NASA team’s map release, one of Garrison’s goals for the map was to inspire people to get to the paths of the annular and total eclipses, which she didn’t do the last time the Moon’s shadow crossed the continental U.S.
“In 2017, I was in Maryland, so I still got to see a little bit, because I was in a partial eclipse,” she said. “But I didn’t really know any of this back then. This does make me want to go to, say, Albuquerque in 2023. And then in 2024 to go more south.”
Garrison worked through many revisions to try to make the map both aesthetic and practical, to help people both inside and outside the paths to plan their eclipse experience.
“It took a lot of trial and error. I wanted it to be useful to the reader but not overwhelming – and still be a pretty product to look at to catch people’s eye.”
Offered at the end of this article is a video that provides an overview of the map to help provide more information on navigating the map and understanding bow to view the two solar eclipses. You can learn more about the NASA’s Solar Eclipse Map here.

 The Sun is more active than it’s been in years and we also have the Annular Solar Eclipse on October 14, 2023 and the Total Solar Eclipse on April 8, 2024! If you’d like to learn more about the technology behind solar observing, solar imaging and more, you can check out our free publication, “The Definitive Guide to Viewing and Imaging the Sun”. You don’t have to sign up or provide any information, simply click here and enjoy reading!
And to make it easier for you to get the most extensive news, articles and reviews that are only available in the magazine pages of our sister publication, “Astronomy Technology Today”, we are offering a 1-year magazine subscription for only $6! Or, for an even better deal, we are offering 2 years for only $9. Click here to get these deals which only will be available for a very limited time. You can also check out a free sample issue here.